I wanted to loop you in on some due diligence and changes we made to our portfolios, along with a recap of how markets performed in July, during which even our most conservative portfolio outperformed Vanguard’s 50% equity model. I’ll finish it off by explaining how the monthly job figures are calculated, which I feel is a timely topic given the massive revisions to the May and June figures.
Portfolio Updates
The spike in volatility markets experienced at the end of July created a great buying opportunity to add another structured note for clients, which we were able to lock in at the perfect time, after the massive job revision figures were announced, but before Trump fired the head of the BLS a few hours later.
These notes are very similar to the ones we added at the end of May, with a few notable changes, so you may want to refer back to the May Recap if you want a refresher on how Dual Directional Notes works.
Of all the structured notes we used (or even considered), this is my favorite to date. Here’s a breakdown of the terms we were able to get for you:
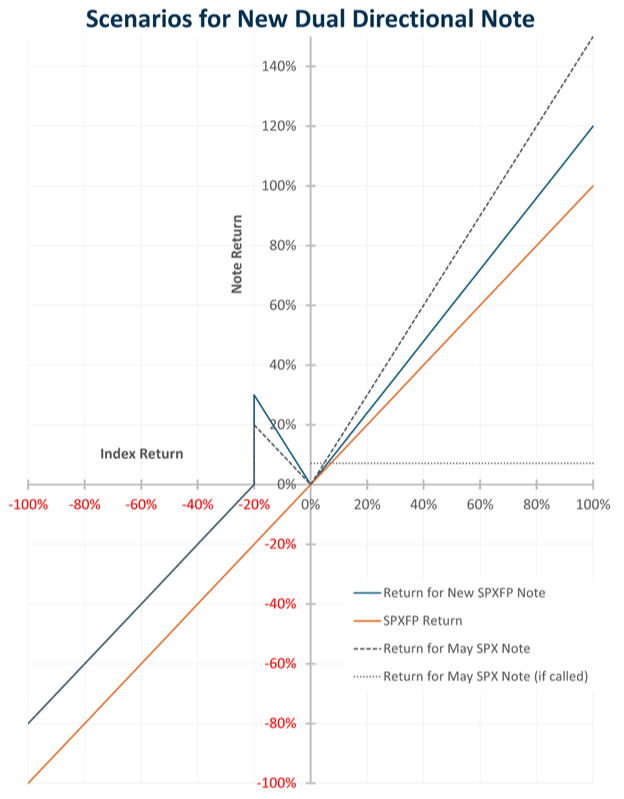
- Matures in 3 Years – Expanding this by an additional year gave us a material increase in the participation rate and increases the likelihood of the index being higher at maturity
- 120% Upside Participation – If the index is higher when the notes mature, your return is 120% of the index’s return, with no cap on the maximum gain, which also benefits from the additional year added to the duration of the notes
- 150% Downside Absolute Return – If the index is down 20% or less at maturity, your return is 150% of the index’s Absolute Return (i.e. if SPXFP is down exactly 20%, your return will be +30%)
- 20% Downside Protection – Just like the May notes, if the index is down more than 20% at maturity, you only participate in the portion beyond 20%, on a 1:1 basis, as the 150% downside multiplier does not apply (i.e. a 30% drop would result in a 10% loss)
- Non-Callable – Unlike the notes we added in May, these notes cannot be called away early, eliminating the risk of having the notes redeemed early and missing out on the return multipliers
We were able to achieve all of these favorable terms by using the S&P 500 Futures Excess Return (SPXFP) as the underlying index, rather than the S&P 500 index (SPX) directly. In short, SPXFP’s correlation to SPX, since its inception in early 2011, has been over 96%, with the average being over 99%.
Due to the way futures are priced, using this index facilitates much better terms when buying structured notes in high-interest rate environments. Had we used SPX, the maximum gain would’ve been capped and/or required an auto-call feature (and at an unattractive rate). For some context, an SPX note that was issued 6 days earlier had a 27.5% return cap, a 25% buffer, and no multiplier on the upside participation or on the absolute return.
Explaining the details of index would lead to a much longer post, and likely leave you confused, but feel free to reach out to me directly if you want to understand the index better.
While I love talking about the benefits, it would be irresponsible to address the opportunity cost risk, which would occur if the index ends flat, as structured notes don’t participate in any dividends that you otherwise would’ve received if you were just invested in an S&P index fund over those 3 years, or interest if you just stuck it in a money market.
Here are some visuals of the different outcome scenarios at maturity, based on where the index closes. As a reference point, included the SPX note we added in May, represented by the dotted lines.
Better Performance Reports Coming
As I’ve mentioned in the past, due to the way structured notes are valued prior to maturity gives an inaccurate representation of performance (unless you were selling it that day), as it’s based on what the issuer of the note offers to buy them back at each day, rather than what their value at maturity would be based on the terms of the note.
We finally received approval from our compliance team to add a supplemental chart each month, which will display the intrinsic value of the notes (i.e. what they would be worth at maturity, based on the performance of the underlying index for each). I’ll explain this in more detail next month, but we feel this will provide a better representation of our portfolio performance, given that we are focused on long-term performance, and plan to hold all structured notes to maturity.
Figures for the Jobs Reports
Given the material revisions to the number of jobs added for May and June, revised downwards by 87% and 90% respectively, I felt a crash course on how the job figures are determined would be a timely topic.
Each month, the Bureau of Labor Statistics (BLS) produces the Employment Situation Report (aka the Jobs Report) using two major surveys; the Current Population Survey (aka Household Survey) and the Current Employment Statistics (aka Establishment Survey).
The Household Survey interviews around 60k households to estimate the unemployment rate, while the Establishment Survey asks roughly 122k businesses and government agencies, encompassing over 666k worksites, to estimate non-farm payroll employment. These surveys are conducted by trained interviewers and can be done via phone, online, or in-person.
The BLS then releases a preliminary estimate early each month, followed by two rounds of revisions as more data becomes available, and refinement for seasonal adjustments. Revisions are a normal, and essential part of the BLS process. In other words, the initial jobs report is based on incomplete data, as not all employers respond by the deadline, but as more responses come in over the following weeks, the BLS updates its figures before finalizing them.
At the end of July, the May and June 2025 figures were revised downward by a combined 258k jobs (89%), marking the largest two-month revision outside of a recession. This was due to a combination of slowing economic activity, declining survey response rates and seasonal adjustment challenges, particularly in education, and those small business sectors affected by tariffs and immigration policy.
Like the Fed, the BLS operates as an independent agency, designed to be free from political influence, and is tasked with producing objective, accurate data about the U.S. labor market, which both the Fed and investors rely on for making decisions. The monthly Jobs Report is built on rigorous survey methods and long-standing procedures, which the BLS Commissioner oversees the operations of, but does not participate in the data collection/analysis process.
Trump’s decision to fire the BLS Commissioner, mere hours after the revisions were announced, sparked increased discussions about the role of leadership in statistical agencies. Regardless of how your political beliefs, and whether the firing of the BLS Commissioner was warranted, revisions as large as those for May and June, at a time when there weren’t any catastrophic events (like COVID or during a recession, indicates there a likely shortcomings in the process, and that adjustments or improvements to the methodology may be in all of our best interests. Maintaining trust in the BLS’s independence helps ensure that everyone, from investors to government agencies, can rely on the data released with a reasonable degree of accuracy.
The One Big Beautiful Bill Update
If you missed it, I’d also encourage you check out our overview of the new tax bill we previously sent out to learn how it may impact your tax bill.
Closing Comments
That’s a wrap. We appreciate the opportunity to keep you informed and thank you for the continued trust you place in us to guide you on your financial journey. Our mission remains helping you stay confident in your financial plan—so you can focus on what matters most.
I’ll be back in a couple of weeks with the August Recap!
Laurence
Disclosures
Investing involves the risk of loss. This content is for informational purposes only and should not be, nor regarded as personalized investment advice or relied upon for investment decisions. Laurence Schiffman and Traverse Planning are affiliates of Clear Creek Financial Management and may maintain positions in the securities discussed in this video. All opinions expressed here are solely those of Traverse Planning and do not reflect the opinions of Clear Creek Financial Management.
This content, which contains security-related opinions and/or information, is provided for informational purposes only and should not be relied upon in any manner as professional advice, or an endorsement of any practices, products or services. There can be no guarantees or assurances that the views expressed here will be applicable for any particular facts or circumstances, and should not be relied upon in any manner. You should consult your own advisers as to legal, business, tax, and other related matters concerning any investment.
The commentary in this “post” (including any related blog, podcasts, videos, and social media) reflects the personal opinions, viewpoints, and analyses of Traverse Planning, and should not be regarded as the views of Clear Creek Financial Management or its respective affiliates or as a description of advisory services provided by Traverse Planning or performance returns of any Traverse Planning Investments client.
References to any securities or digital assets, or performance data, are for illustrative purposes only and do not constitute an investment recommendation or offer to provide investment advisory services. Charts and graphs provided within are for informational purposes solely and should not be relied upon when making any investment decision. Past performance is not indicative of future results. The content speaks only as of the date indicated. Any projections, estimates, forecasts, targets, prospects, and/or opinions expressed in these materials are subject to change without notice and may differ or be contrary to opinions expressed by others.


